Solutions · Data
Scattered data doesn't create clarity.
Almost every business already has the numbers. They're in the CRM, the accounting software, the spreadsheet, the sales platform and the WhatsApp chats. We build the layer that brings those sources together and turns what's scattered into a view that helps you decide.
The problem
If you find out how the month went on the 5th, you're always deciding about the past
From the first day of last month to the day the books close, 35 days go by. In that window, the business has already hired, bought inventory and turned customers away without seeing what was going on.
Sound familiar?
- To know how much came in today, someone opens three screens and adds it up in their head
- The number that matters lives in a spreadsheet only one person knows how to use
- Two departments report different numbers for the same question
- No one can say what it cost to bring in a new customer
- A bad month only shows up when it's too late to react within it
What changes
What changes when your data connects
- Every number has a known source, and everyone looks at the same one
- What came in, what went out and what's stuck shows up without anyone entering it by hand
- A few metrics, chosen for the decision they help you make
- Anything there's no basis to measure shows up as no data, never as zero
What's included
What we can build
-
Management Dashboard
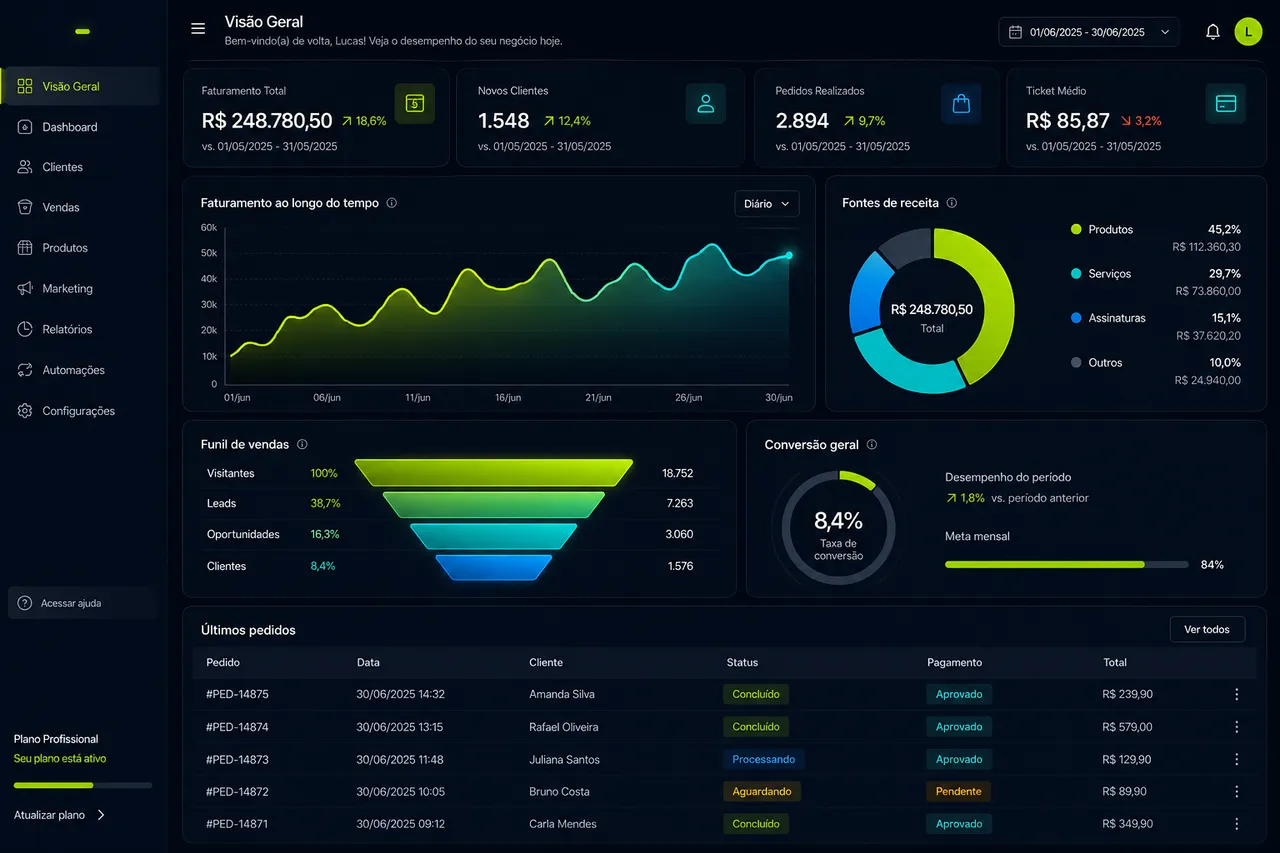
The metrics leadership watches, updated automatically and readable in thirty seconds on a phone.
-
Connected Data Sources
CRM, accounting, sales, website and customer service read and cross-referenced with no manual entry.
-
Sales Metrics
Where customers come from, what's going cold and what turned into a sale.
-
Inventory and Operations View
What's available, reserved or stuck, at the moment you ask.
-
Website and Campaign Tracking
Analytics and events set up to measure what matters, not just visits.
How we think
Clarity beats quantity
A dashboard with a hundred metrics is the same as none. We start with the decision your business needs to make, and only then choose the number that helps make it.
Every number shows where it came from. When there's no basis to calculate something, the screen says so instead of showing zero, because zero is a claim and nobody made it. And an estimated number is labeled as an estimate.
From scattered data to a decision
-
Sources
CRM, accounting, sales, spreadsheets, customer service.
-
Connection
Read automatically, no typing.
-
Metrics
A few, each with one definition.
-
Decision
While there's still time to change the month.
-
Review
What you measure changes as your business does.
Tools we've already worked with on this kind of project. The choice comes after the problem.
- Notion
- Supabase (Postgres)
- Google Analytics 4
- Google Search Console
- Meta (Facebook and Instagram)
Where we've put this to work
Real work, with each project's stage out in the open.
Client projects and our own technology. The label tells you which is which.
Overview for a fashion boutique
A dashboard with sales, inventory and items out on approval by period, in the store's time zone, with no made-up percentages when there's nothing to compare against.
Read in Portuguese In-house technologyDream Harbor's sales dashboard
Reads the CRM live and shows the funnel, every open conversation and recent technical failures.
Learn moreWhen it makes sense
Not every problem calls for this solution.
Telling you when it doesn't fit is part of the job. Sometimes the right answer is something else, and sometimes it's leaving things as they are.
It makes sense when
- Important decisions depend on numbers that arrive late
- The information exists, but it's split across three or more tools
- Reports are built by hand and nobody fully trusts them
- You invest in marketing and don't know what came back
It doesn't make sense when
- Source data is entered haphazardly and needs a process before it needs a dashboard
- No one will look at the dashboard, because decisions happen somewhere else
- The question comes up once a year and a spreadsheet handles it
Frequently asked questions
Do I need to replace the systems I already use?
Most of the time, no. The idea is to read what already exists and bring it together, not make you start over. If a replacement is truly needed, you'll know before any proposal.
Will someone have to update this every day?
No. A dashboard that depends on someone filling it in is the same spreadsheet in different clothes, and it dies for the same reason.
Which metrics should I track?
The ones that change a decision. Revenue and number of customers almost always make the cut. The rest depends on your operation's bottleneck. A metric nobody uses to decide just takes up space.
Can I see an example first?
Yes. We use dashboards like these in Dream Harbor's own operation and show them working on the call.
Keep exploring
Technology and intelligence
Online presence

Let's talk
Which decision in your business is made today without a number?
Tell us which one. We'll see where the data would come from and whether that view is worth building.
Prefer email? dreamharboragency@gmail.com